
Levels of benzene exceeded the EU and UK ambient AQS of 5 ug/m3 during January to April 2019.
Public Health England’s third report released today is a cause of real concern.
Of course, it basically re-states its position in previous reports that there is nothing to worry about.
But in PHE’s second report (p.11), it showed a handy comparison table between weeks 1-16 and 17-27:
This table shows significant increases in average and maximum (range) recorded
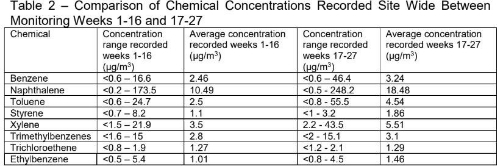
levels of benzene and naphthalene in the 17-27 week period (October to December 2018), compared to the 1-16 week period (June to September 2018).
In their third report, though, there was no such useful comparison table for weeks 28- 47, merely a total for weeks 1-47, which includes 4 weeks where the soil treatment ‘hospital’ was no longer in use.
So I made my own comparison table (please feel free to share, edit, copy, download - I have my own separate version, too):
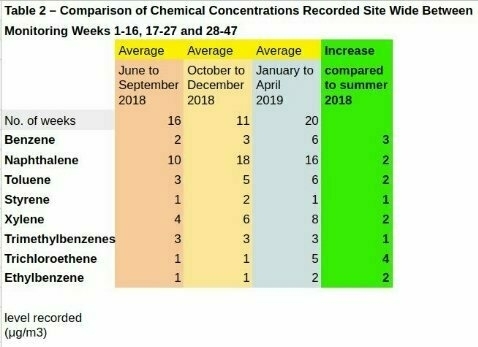
My numbers are rounded to make it easier to read.
Assuming my calculations are correct (and if anyone cares to check, that would be fantastic), what it seems to show is that:
-
Levels of benzene exceeded the EU and UK ambient AQS of 5 ug/m3 during January to April 2019.
-
Levels of benzene were about 3 times higher between January and April this year, than between June and September during the heatwave last summer.
-
Levels of naphthalene were over one and a half times higher.
-
Levels of trichloroethene were 4 times greater.
-
Levels of ethylbenzene were 2 times higher.
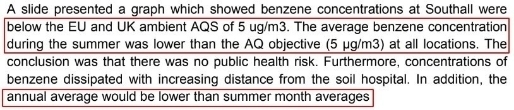
This is contrary to what Damian Leydon, Berkeley Group’s Operations Director assured Ealing Council’s Air Quality Scrutiny Panel (p.12) in September 2018:
Why didn’t PHE produce the comparison table in their third report like they did in their second report?