
Two weeks ago, I reported on the results of my research into the fly-tipping epidemic that has hit Ealing, and Southall in particular.
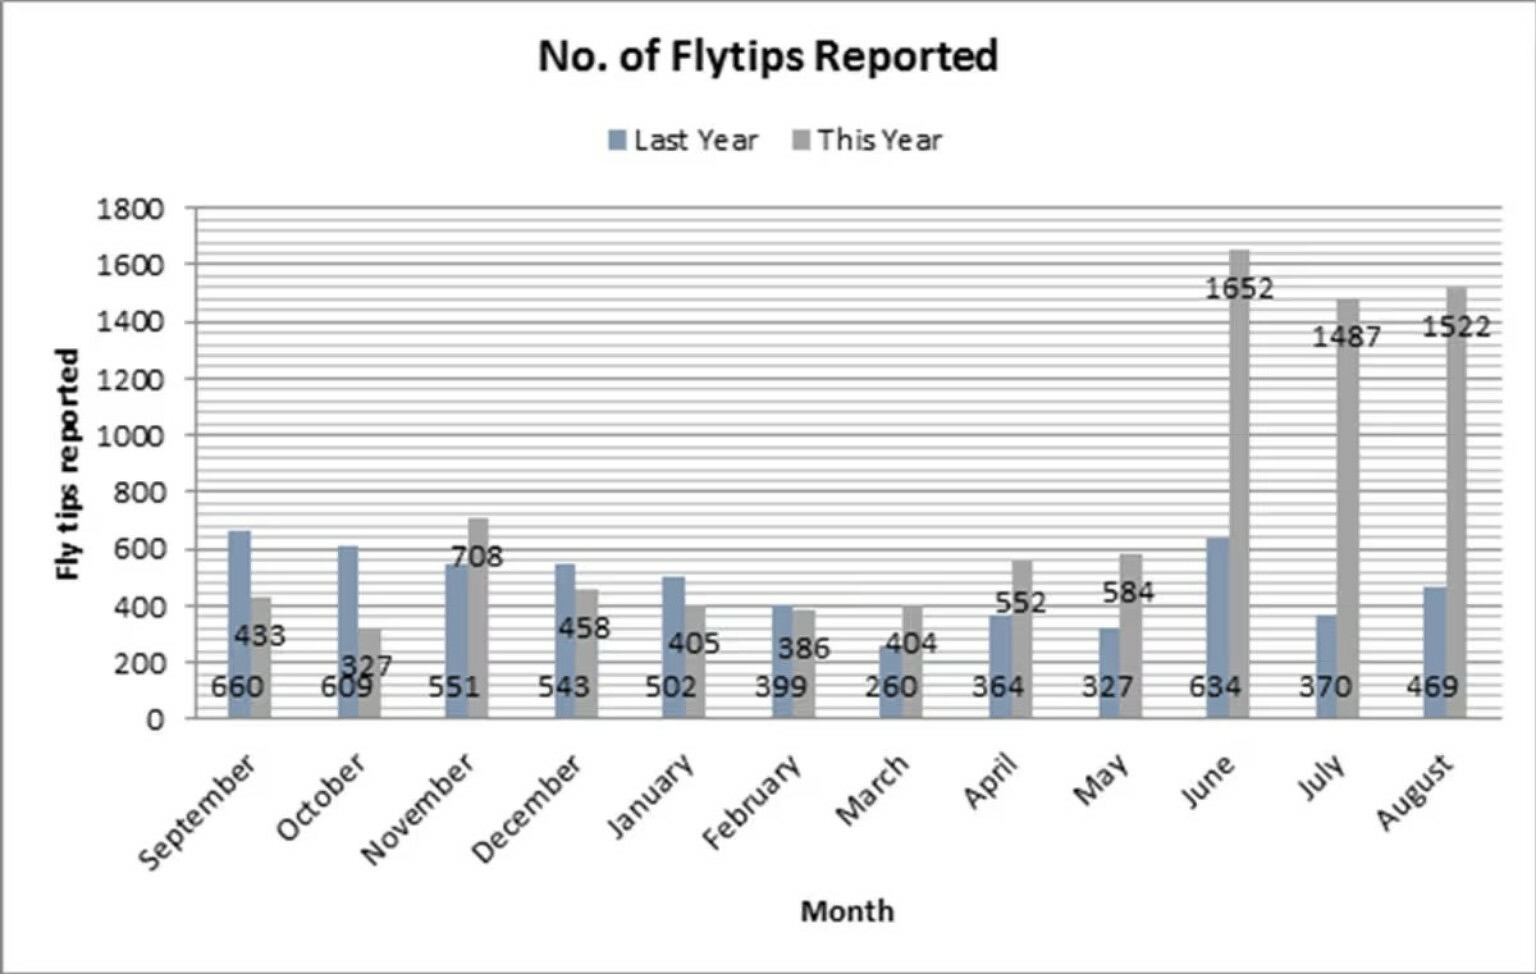
In short, fly-tipping across the borough literally doubled from July 2016, immediately after Ealing Council reduced household waste collections from weekly to fortnightly.
It’s remained at that high level ever since, and residents report that it’s getting even worse in recent years.
The nature of these sudden and sustained increases strongly indicate that it’s not due to any increases in population - documented or otherwise. Population increases are gradual over time and simply not large enough to account for such a massive change in the amount, or rate, of fly-tipping reports.
The data also suggests that the council’s stated aims to increase recycling rates and save money have catastrophically failed. Recycling rates are around the same level as they were a decade ago, and the council now spends more cleaning up dumped rubbish than it saved by halving collections.
The council’s much publicised and repeated efforts to tackle, fight, crackdown on, and criminalise fly-tipping have quite clearly completely failed.
A policy that halves collection frequency, produces a sustained doubling in per-resident fly-tipping, and results in higher net clean-up costs than the savings it generated raises serious questions about whether the change was economically or operationally sound.
Somewhat bizarrely, in the face of such persistent failure, Ealing Council has this month nominated itself for a prestigious public sector award for their social media campaign “This is our home, not a tip”.
Just a couple of months ago in a BBC London Politics Show interview, Ealing Council leader Peter Mason acknowledged “an exponential increase in fly-tipping” while simultaneously claiming a 55% reduction in fly-tipping reports in Southall.
Only today I received Ealing Labour’s election leaflet claiming a massive (and extremely implausible) 54% reduction in fly-tipping across Southall.
Meanwhile, the daily reality for those of us who live here is that Ealing, and Southall in particular, is drowning in rubbish left on pavements.
Read on for details, and more on what the data tells us.
Since my article a fortnight ago, I found some more information that confirms what we already knew beyond any doubt.
In July 2016, just weeks after Ealing replaced black bin bags with wheelie bins and switched to alternate weekly rubbish collections, Southall residents were already warning something had gone wrong.
At the Southall Broadway Ward Forum (12 July 2016), residents reported:
- Overflowing bins
- Increased fly-tipping
- More foxes and rats
- A feeling they were being “made to live in slums”
The official response recorded in the action log?
“Introduction of the alternate weekly collection service should help reduce this.”
That was the expectation.
What followed was the complete opposite.
2016: The Spike
Two MyLondon articles later that year captured the shift.
New wheelie bins replaced a system of bin bags on June 6, and the council switched to alternate weekly collections.
The council claimed the change resulted in a sharp rise in recycling — 55% of household waste collected in the first month compared to 48% in the previous year.
At the same time:
- Fly-tipping ines were increased from £80 to £400
- Three new “enforcement trucks” were introduced
- Public messaging intensified
A council spokesperson indicated that the council expected an increase in fly-tipping:
“We anticipated it would take a little time for people to get used to alternate weekly collections and have a team of people accompanying the collection crews, helping educate residents on how to use the wheelie bins properly.”
And just one month later in July 2016, residents linked the change to increased fly-tipping.
But a council spokesperson insisted the opposite:
“We have seen a steady reduction in reported incidents of fly tipping.”
Somewhat confusingly, Cllr Bassam Mahfouz explained that increased enforcement and removal activities contributed to an increase in recorded fly-tips:
“Labour have set up a dedicated task force to find and prosecute culprits as well as carrying out thousands of visits to help educate people on how to dispose of their rubbish – we are going out of our way to find and remove dumped rubbish which accounts for a portion of the increase in recorded fly tips.”
By November 2016, Mahfouz was reporting on his crackdown on fly-tipping, promising fly-tippers:
We will find you and we will fine you.
In February 2017, Mahfouz claimed:
“The number of fly-tips reported to the council each week has dropped by 46%.”
Unfortunately, the data simply doesn’t support these claims.
| Year | Measure Type | Total Cases | Population | Per 1,000 Residents | Change vs 2012 |
|---|---|---|---|---|---|
| 2012–13 | Confirmed incidents | 6,352 | 336,900 | 18.9 | Baseline |
| 2015–16 | Confirmed incidents | 7,032 | 339,700 | 20.7 | +9% |
| 2016–17 | Confirmed incidents | 14,270 | 340,000 | 42.0 | +122% |
| 2023–24 | Confirmed incidents | 16,828 | 375,340 | 44.8 | +137% |
| 2024–25 | Confirmed incidents | 25,394 | ~390,000 | ~66 | +245% |
| 2025–26* | Projected (reports) | ~30,000 | ~392,000 | ~76 | +302% |
Defra’s national dataset shows:
- 2015–16: 7,032 incidents
- 2016–17: 14,270 incidents
Per 1,000 residents:
- 2015–16: 20.7
- 2016–17: 42.0
That is a doubling of the per-resident rate in a single year.
Population barely moved that year.
This was not gradual drift.
It was a sharp baseline shift.
2018: “We’ve Got to Sort Out Fly-Tipping”
In May 2018, Peter Mason tweeted:
“As well as Ealing Labour’s priorities for genuinely affordable homes and decent jobs, we’ve got to sort out the lorries on Scotts Road, flytipping and the canal…”
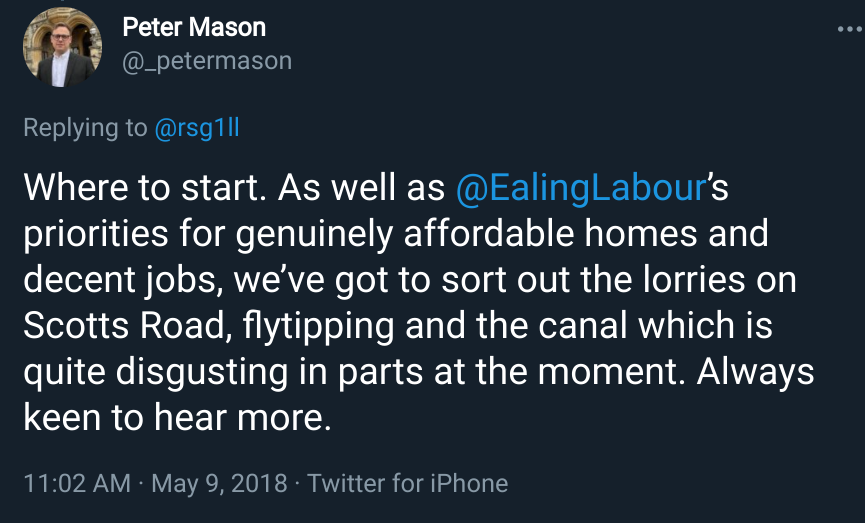
Two years after the spike, the problem was acknowledged publicly.
But no formal public evaluation of the 2016 service change and its long-term fly-tipping impact was published.
2022: Operational Success Narrative
By June 2022, the council’s Waste Management presentation highlighted:
- 135,000 bins emptied weekly
- 99.96% collection success
- 47% recycling rate
- £22m Greener Ealing operation
Recycling performance became the headline metric, but down from 48% in 2015.
Fly-tipping trends were not foregrounded in the presentation. Perhaps because they had doubled.
2023–2026: The Second Surge
More recently, incidents have surged again.
Defra data shows:
- 2022–23: 12,922 incidents
- 2023–24: 16,828 incidents
Last year, Ealing Council leader Peter Mason went as far as to “declare war” on fly-tippers.
Yet ITV reports that in 2024–25, Ealing recorded approximately 25,394 incidents, placing it in England’s top ten fly-tipping hotspots.
The Council Plan Performance Report Q2 2025/26 confirms:
“Fly tipping incidents have increased by around 50% year on year since 2022/23…”
The same report notes:
- Clearance performance below target
- Response times extended
- Additional removal teams deployed
- CCTV expansion
- Behaviour change pilots
This is escalation.
National Context
BBC reporting confirms that fly-tipping has increased nationally by around 9% year-on-year.
ITV reports Croydon as England’s worst hotspot:
- Croydon: 53,268 cases
- Population ~390,000
- ~136 incidents per 1,000 residents
Ealing:
- ~25,394 cases
- Population ~386,000
- ~66 incidents per 1,000 residents
Ealing is not the worst in England.
But its internal structural break in 2016 (when fly-tipping incidents doubled), and from 2023 when incidents increased by 50% year-on-year, remains unusually sharp compared to gradual national increases of 9%.
Is It Population Growth?
Ealing’s population has increased approximately 13.8% over 13 years.
Fly-tipping per 1,000 residents:
- 2012–13: 18.9
- 2016–17: 42.0
- 2023–24: 44.8
This is not proportional demographic drift.
Per-resident incidence more than doubled.
What About “Undocumented” Population Growth?
Some argue the rise could be due to hidden or undocumented population growth.
The arithmetic does not support this.
In 2016–17, there were 14,270 incidents.
To return to the previous per-1,000 baseline (around 21 per 1,000), Ealing’s population would have needed to be approximately:
680,000 residents.
That is roughly double the official estimate.
There is no evidence — from GP registrations, school rolls, council tax base, housing stock, electoral register data, or infrastructure capacity — to suggest a hidden population of that scale.
Even between 2022 and 2024, incidents rose nearly 96%, while population rose around 5%.
To explain the surge purely through undocumented growth would require tens of thousands of additional residents appearing in two years without showing up anywhere else in the system.
That is implausible at scale.
The Counter-Narrative Pattern
Across a decade, the official framing has remained consistent:
- “It’s a national issue.”
- “Enforcement is increasing.”
- “Benefits are largely contingent on changing resident behaviour.”
- “Recycling rates are strong.”
- “Incidents are reducing.”
In 2017, reductions were claimed.
In 2022, recycling success was highlighted (despite being lower than in 2015).
In 2025, enforcement was expanded.
Meanwhile:
- 2016 saw a doubling of fly-tipping.
- 2023–26 shows another surge.
- Cabinet admits ~50% year-on-year growth since 2022/23.
Residents flagged deterioration within weeks in July 2016.
The baseline never returned.
Campaign of the Year?
In 2026, Ealing’s “This Is Our Home, Not a Tip” campaign was shortlisted for an LGC Award under Campaign of the Year.
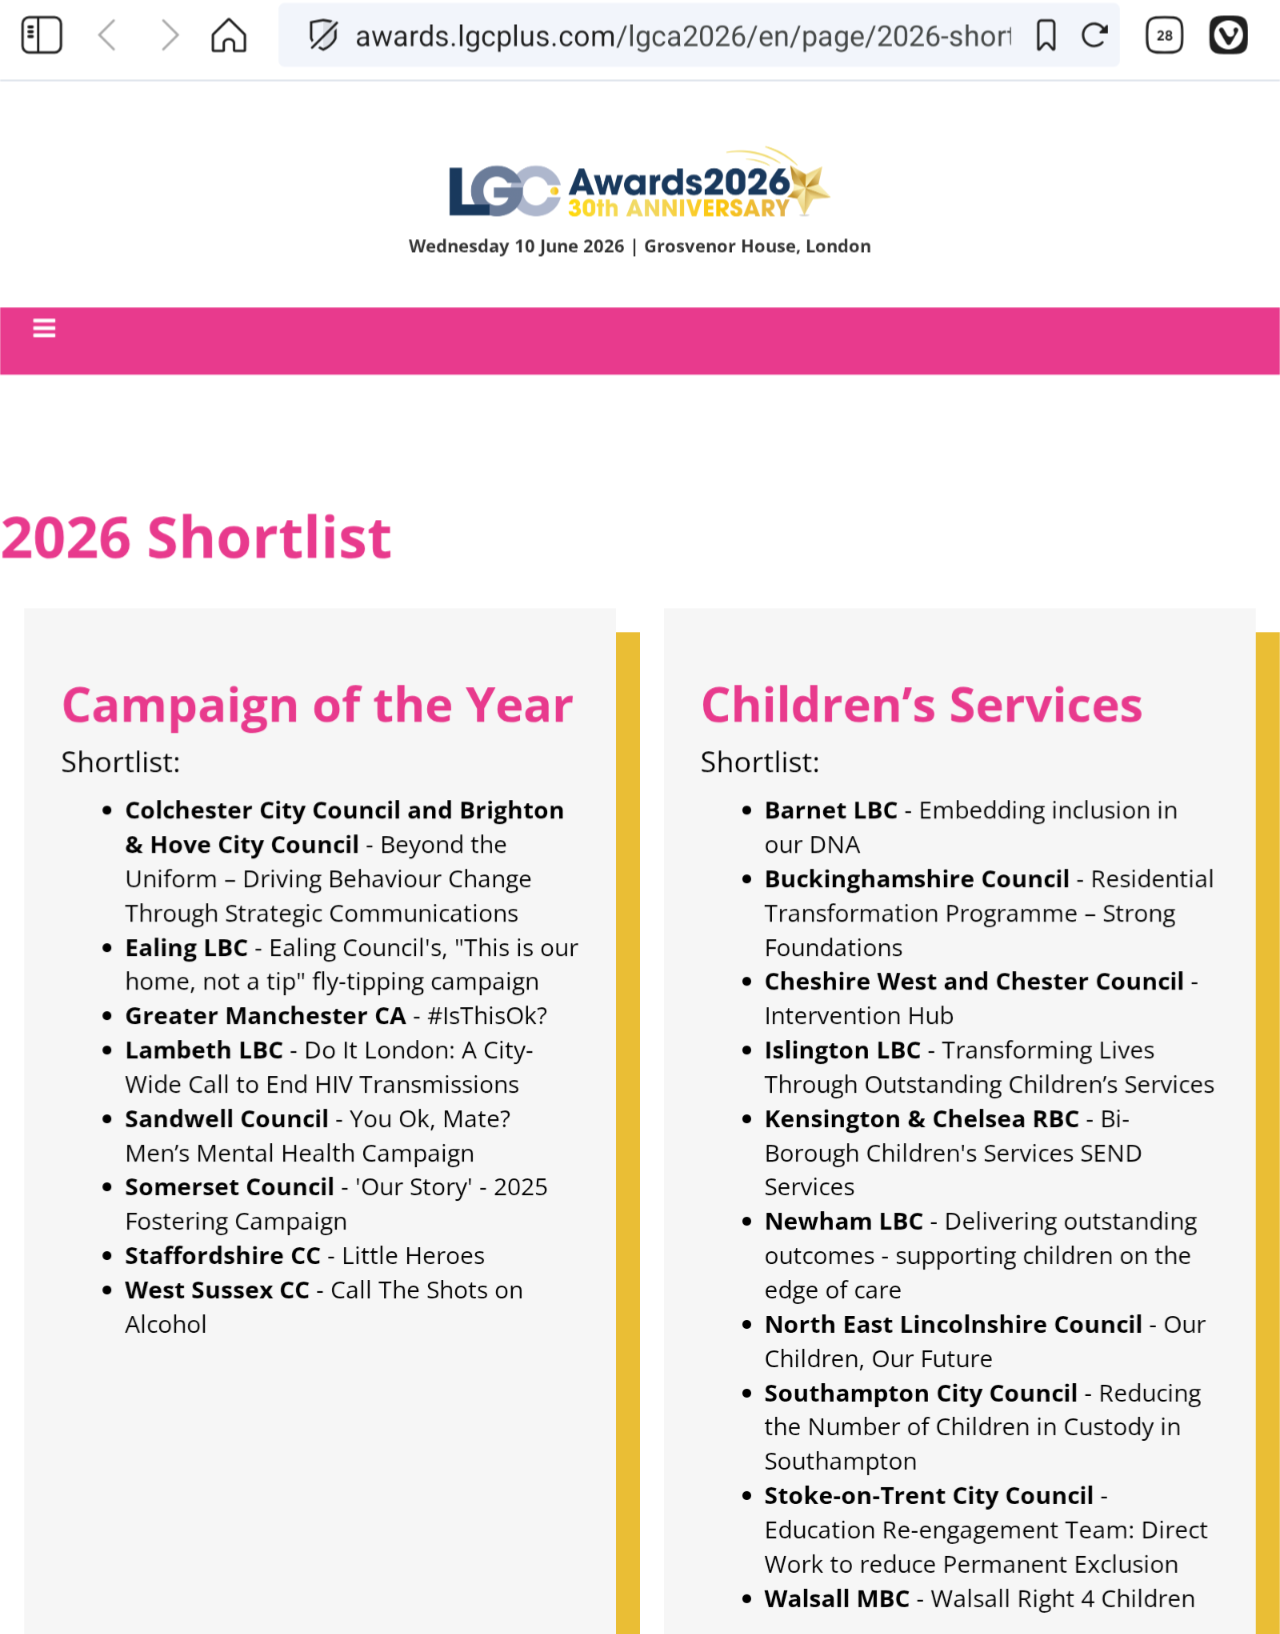
The nomination celebrates messaging.
The data shows:
- A more than 100% per-resident increase after 2016.
- A further surge since 2022-23.
- Incidents now at record highs.
Communications may be award-winning.
But arithmetic remains unimpressed.
The Unasked Question
This is not about denying national trends.
It is not about ethnicity or migration.
It is not about dismissing recycling gains.
It is about a structural question:
Has Ealing ever conducted a formal public evaluation of the 2016 alternate weekly collection policy and its long-term impact on fly-tipping baselines?
Ten years on, “sorting it out” remains a campaign line.
But the data shows two structural inflection points:
- 2016
- 2023
The 2022–23 cost-of-living shock likely increased the baseline pressure on waste systems nationally.
Ealing’s much steeper rise suggests local amplification factors. In Southall, these aare likely to include housing density, overcrowding, higher private sector rents, as well as collection policy, enforcement and recording practices, and over-development minus any major infrastructure mitigations that magnify national economic stress.
The borough’s recycling rate was already ~48% in 2015 — almost exactly where it is today. This suggests that the increase in fly-tipping after 2016 does not stem from a sudden change in recycling behaviour, but rather from structural shifts in waste collection, capacity constraints, and later economic pressures.
If enforcement keeps escalating while incidents keep rising, then perhaps the conversation needs to move beyond slogans and towards systems.
Because arithmetic is harder to campaign against than residents.
Unless you’re Ealing Labour. In which case, you simply claim that fly-tipping is down 54% across Southall!
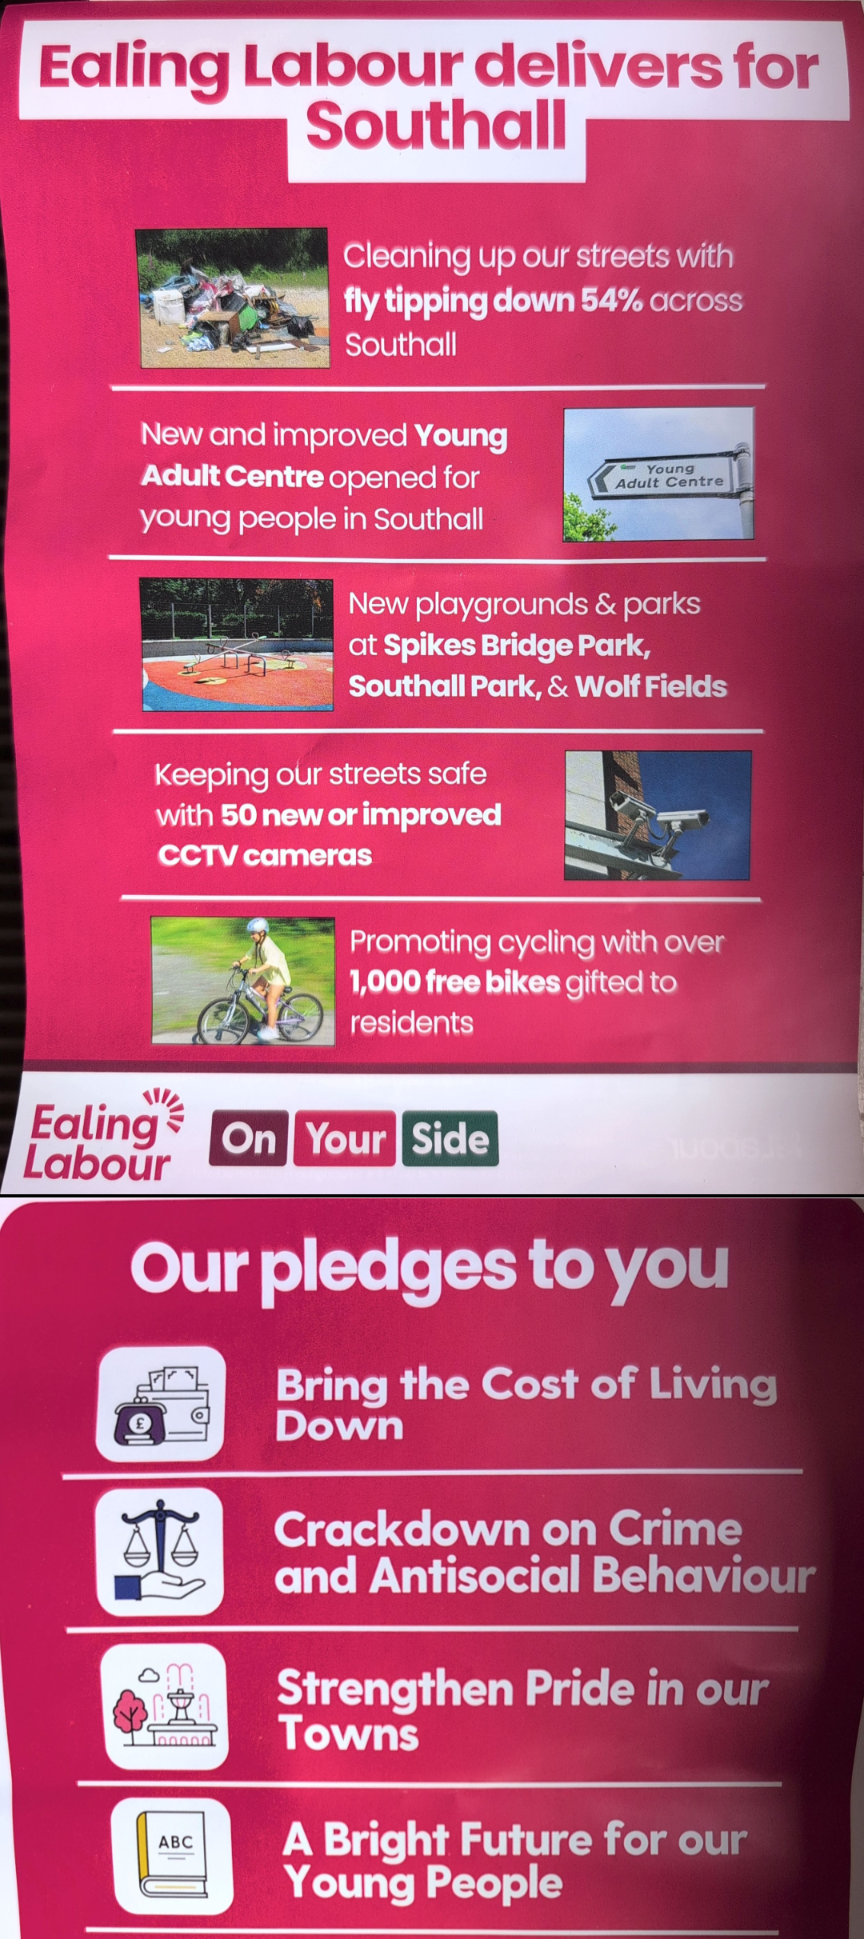
Without a specified baseline year or dataset, the 54% figure cannot be reconciled with published Defra or council performance data.
Let’s hope 7 May election day will see bangarang boomerang and some higher calibre councillors elected?