Update, 1 May 2026: A reader has correctly pointed out that the Defra 2024-25 fly-tipping statistics cover April 2024 to March 2025 — and therefore predate Ealing Council’s “This Is Our Home, Not a Tip” campaign and Peter Mason’s claimed 55% reduction in fly-tipping across Southall, both of which relate to 2025-26. The Defra figures establish the pre-campaign baseline, not the campaign’s results.
However, the contradiction at the heart of this piece does not depend on Defra data. Ealing Council’s own Q2 2025/26 Performance Report — covering the campaign period itself — states explicitly that fly-tipping “has increased by around 50% year on year since 2022/23.” That is the council’s own in-year monitoring, for the same period Mason is claiming a 55% reduction in Southall.
The council’s data and the council leader’s election claim cannot both be true.
The correction strengthens rather than weakens that conclusion.
A postscript to On the Bins Again, Boomerang! and Bangarang!
Ealing Council was shortlisted for an LGC award for their fly-tipping awareness campaign. It was called “This Is Our Home, Not a Tip.”
Defra figures published today show fly-tipping in Ealing rose by 50.9% in 2024-25 to 25,394 incidents — the highest ever recorded in the borough, sixth worst in London, and seventh out of 294 local authorities in England. At 65.8 incidents per 1,000 residents, Ealing is now worse per head than Brent was at any point before its own enforcement crackdown began.
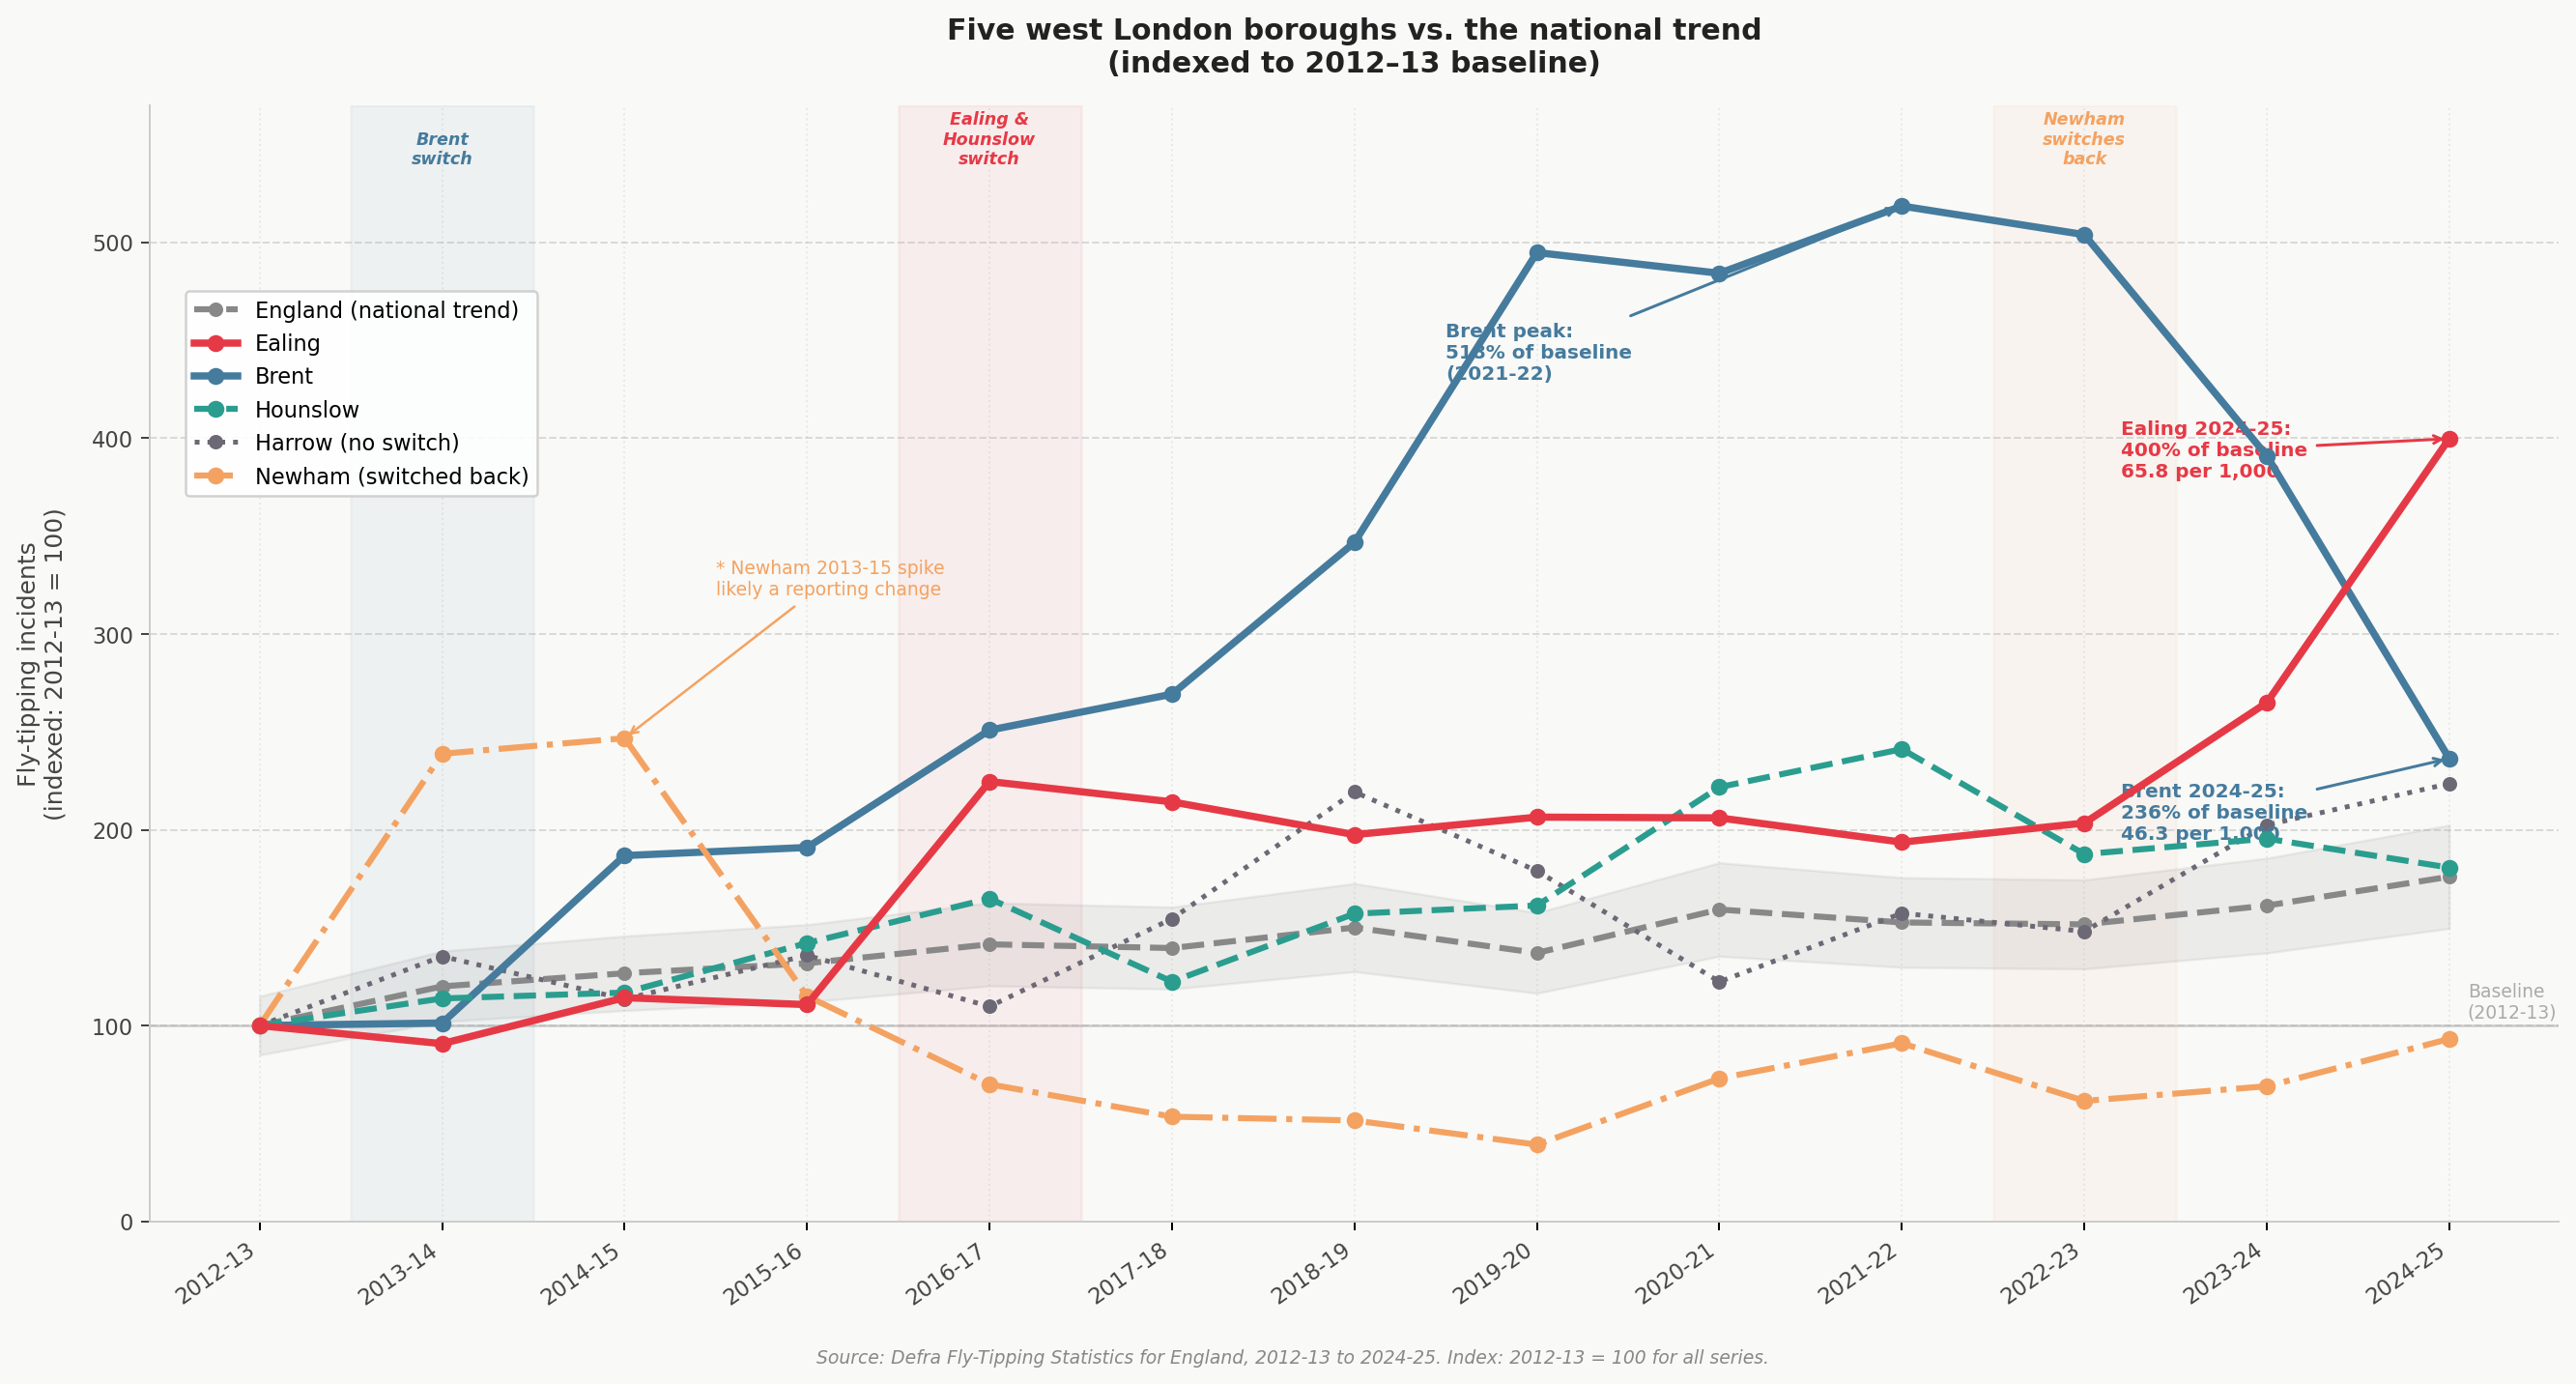
Neighbouring Brent, running an aggressive enforcement campaign for several years and having switched to twin-stream recycling collections in October 2023, is down to 16,338 incidents — 46.3 per 1,000. Harrow, which never switched to fortnightly collections, recorded 13,925 — 51.4 per 1,000.
The enforcement comparison is particularly telling. In 2024-25, Ealing issued 1,993 fixed penalty notices for fly-tipping and saw incidents rise 51%. Brent issued 916 and saw incidents fall 40%. More fines, worse outcome. The difference is not enforcement intensity. It is the structural problem that enforcement cannot fix.
The council’s explanation? Higher figures partly reflect improved reporting by residents. The same explanation Newham offered in 2016 when their new digital reporting system inflated their counts. The difference is that Brent’s improved reporting produced a 40% fall in the same year.
Gareth Lloyd Jones, Managing Director at HIPPO Waste, told Ealing.News that Ealing’s ranking is “despite only capturing publicly reported incidents,” pointing to “a broader underlying problem.” He’s right. It has been documented in some detail: reduced waste collection capacity since 2016, a cost of living crisis reducing residents' ability to pay for disposal, rising private sector rents driving population churn and overcrowding, and a borough where housing density and overcrowding mean the fortnightly system was never designed for the communities it serves. The council’s awareness campaign has 8 million social media impressions. Fly-tipping has 25,394 incidents.
There is one further question the 2024-25 figures raise. In a BBC London Politics Show interview earlier this year, Council Leader Peter Mason claimed a 55% reduction in fly-tipping in Southall. Ealing Labour’s election leaflet repeated the claim as a 54% reduction. No baseline year or dataset was specified for either figure, and as the Boomerang article noted, neither can be reconciled with published Defra or council performance data.
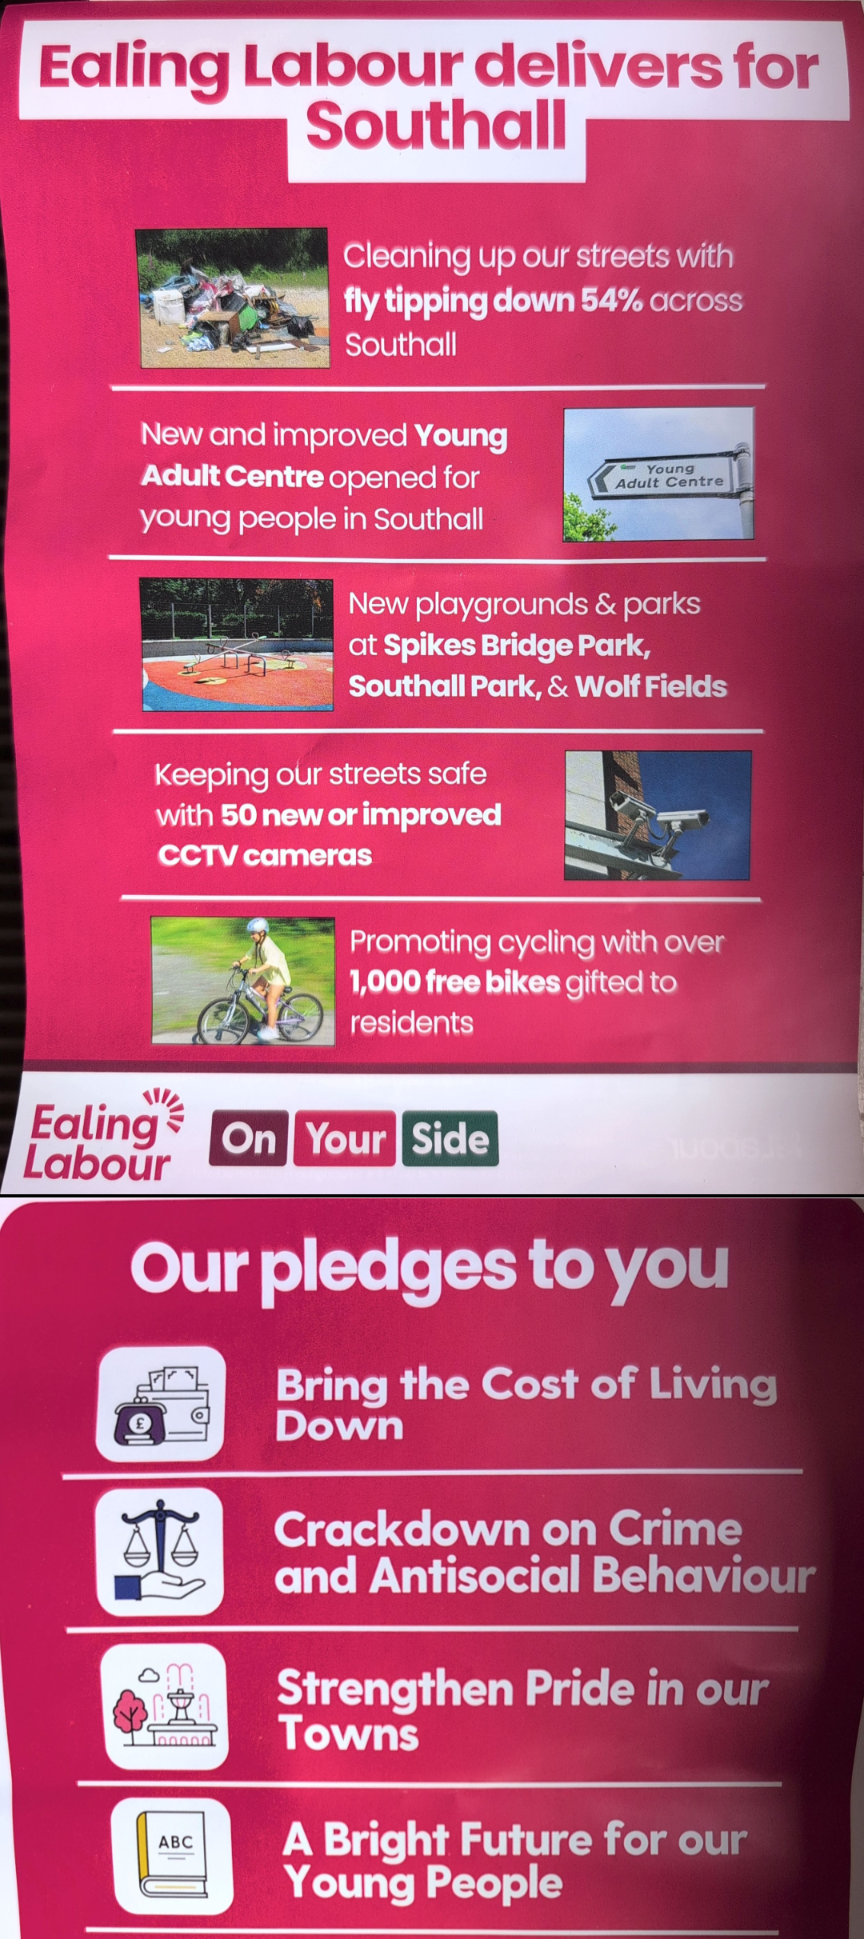
Southall’s official population is around 80,000 — almost certainly an undercount given the scale of undocumented migration into a borough with a 21.5% annual population churn and severe private sector overcrowding. Even on the official figure, if Southall genuinely accounts for roughly a fifth of Ealing’s population, and fly-tipping across the whole borough is up 51% to 25,394 incidents, then a 54% reduction in Southall implies the rest of Ealing has seen something close to a tripling of incidents to compensate. That would represent a catastrophic failure of borough-wide policy that Labour has conspicuously not mentioned. The more likely explanation is that the figure is based on a different metric, a selected time window, or simply cannot be verified — which is why no source was provided.
Ealing Council’s own Q2 2025/26 performance report states explicitly that fly-tipping “has increased by around 50% year on year since 2022/23.” The council’s own data and the council leader’s election claim cannot both be true.
Three articles. Months of Defra data. Five boroughs. One unasked question.
Has the 2016 alternate weekly collection policy been evaluated as a material cause of the sustained and now accelerating rise in fly-tipping?
Still no answer, a week before local elections.
Fly-tipping incident data: Defra Fly-Tipping Statistics for England, 2024-25. Per-capita figures calculated using ONS mid-year population estimates as published in the Defra dataset.