Between June 2018 and May 2019, the developer of Southall Waterside measured the air around the former gasworks every week. Its contractor’s laboratory, Chemtest, tested tubes from up to 29 monitoring points for volatile chemicals while contaminated soil was dug up and treated in the on-site “soil hospital”.
Those results were released under the Environmental Information Regulations in 2019, as hundreds of pages of lab certificates.
The impossible job
Some were saved as machine-readable PDF pages, others appeared to be scanned images. They were not in chronological order, and many of the column headings appear to be mislabelled. Over the last seven years, I spent many a miserable evening attempting to input the data by hand into a spreadsheet, but gave up each time. It was an impossible job, made worse by the emotional impact of seeing the extent and locations of many of the highest readings, and correlating them with my own records of odour reports and the impact I felt it had on the health of my family, friends and neighbours.
Last year, I made a breakthrough using artificial intelligence applications like Claude and ChatGPT to read screenshots of the PDF pages. But again, I couldn’t complete the work – it still required me to do too much of the work manually.
This year, AI capabilities have surged considerably (so much so that we are told that there’s every chance they will destroy humanity before humanity destroys the world), along with my own still rudimentary knowledge of how to use it and get the most out of it. Suffice to say that I have now succeeded in automating the data extraction and verification process. It’s not perfect, but it’s close, and these are my preliminary findings. As far as I’m aware, this is the only independent analysis of the 2018–19 air monitoring data at Southall Gasworks.
I have now put all 684 samples into one dataset, checked each value against its source page, and set residents’ own odour reports against the hourly wind.
I must emphasise that these are preliminary findings. They describe the monitoring; they do not measure anyone’s exposure or health. The full interactive version, with the map, charts and every station, is here: Southall Air Monitoring 2018–19.
The hot spots were by the soil hospital
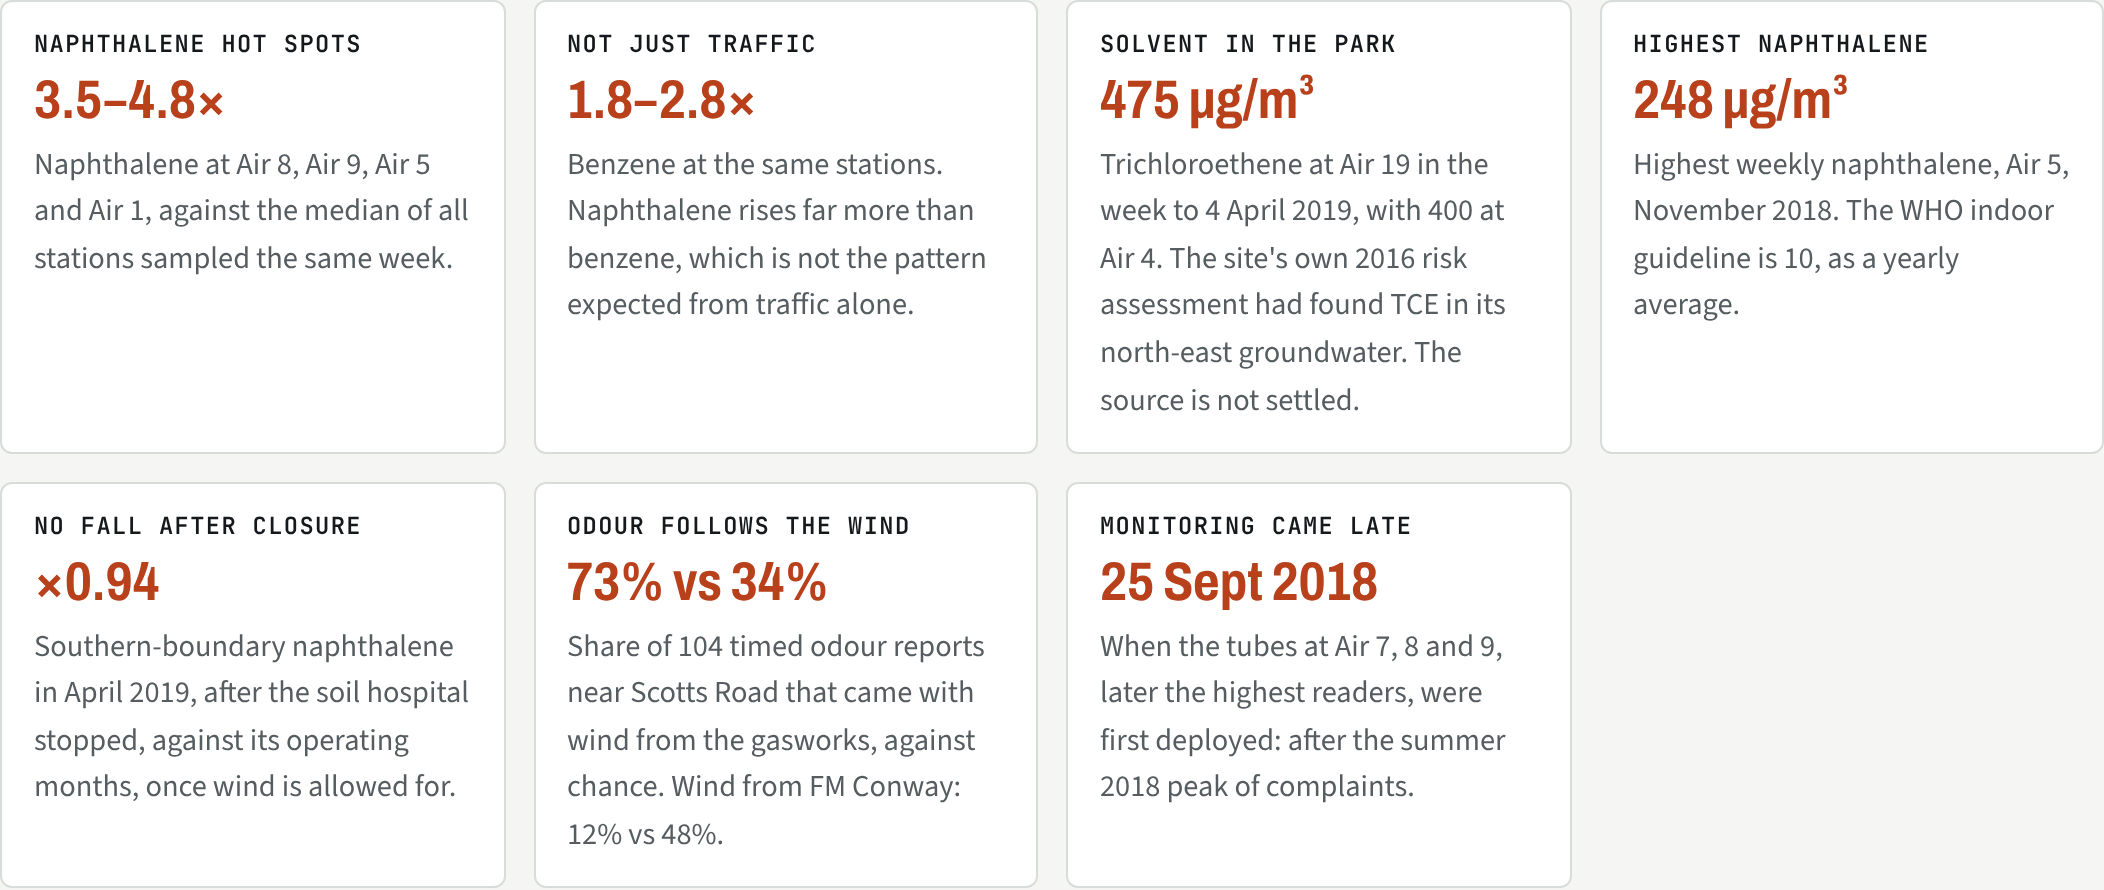
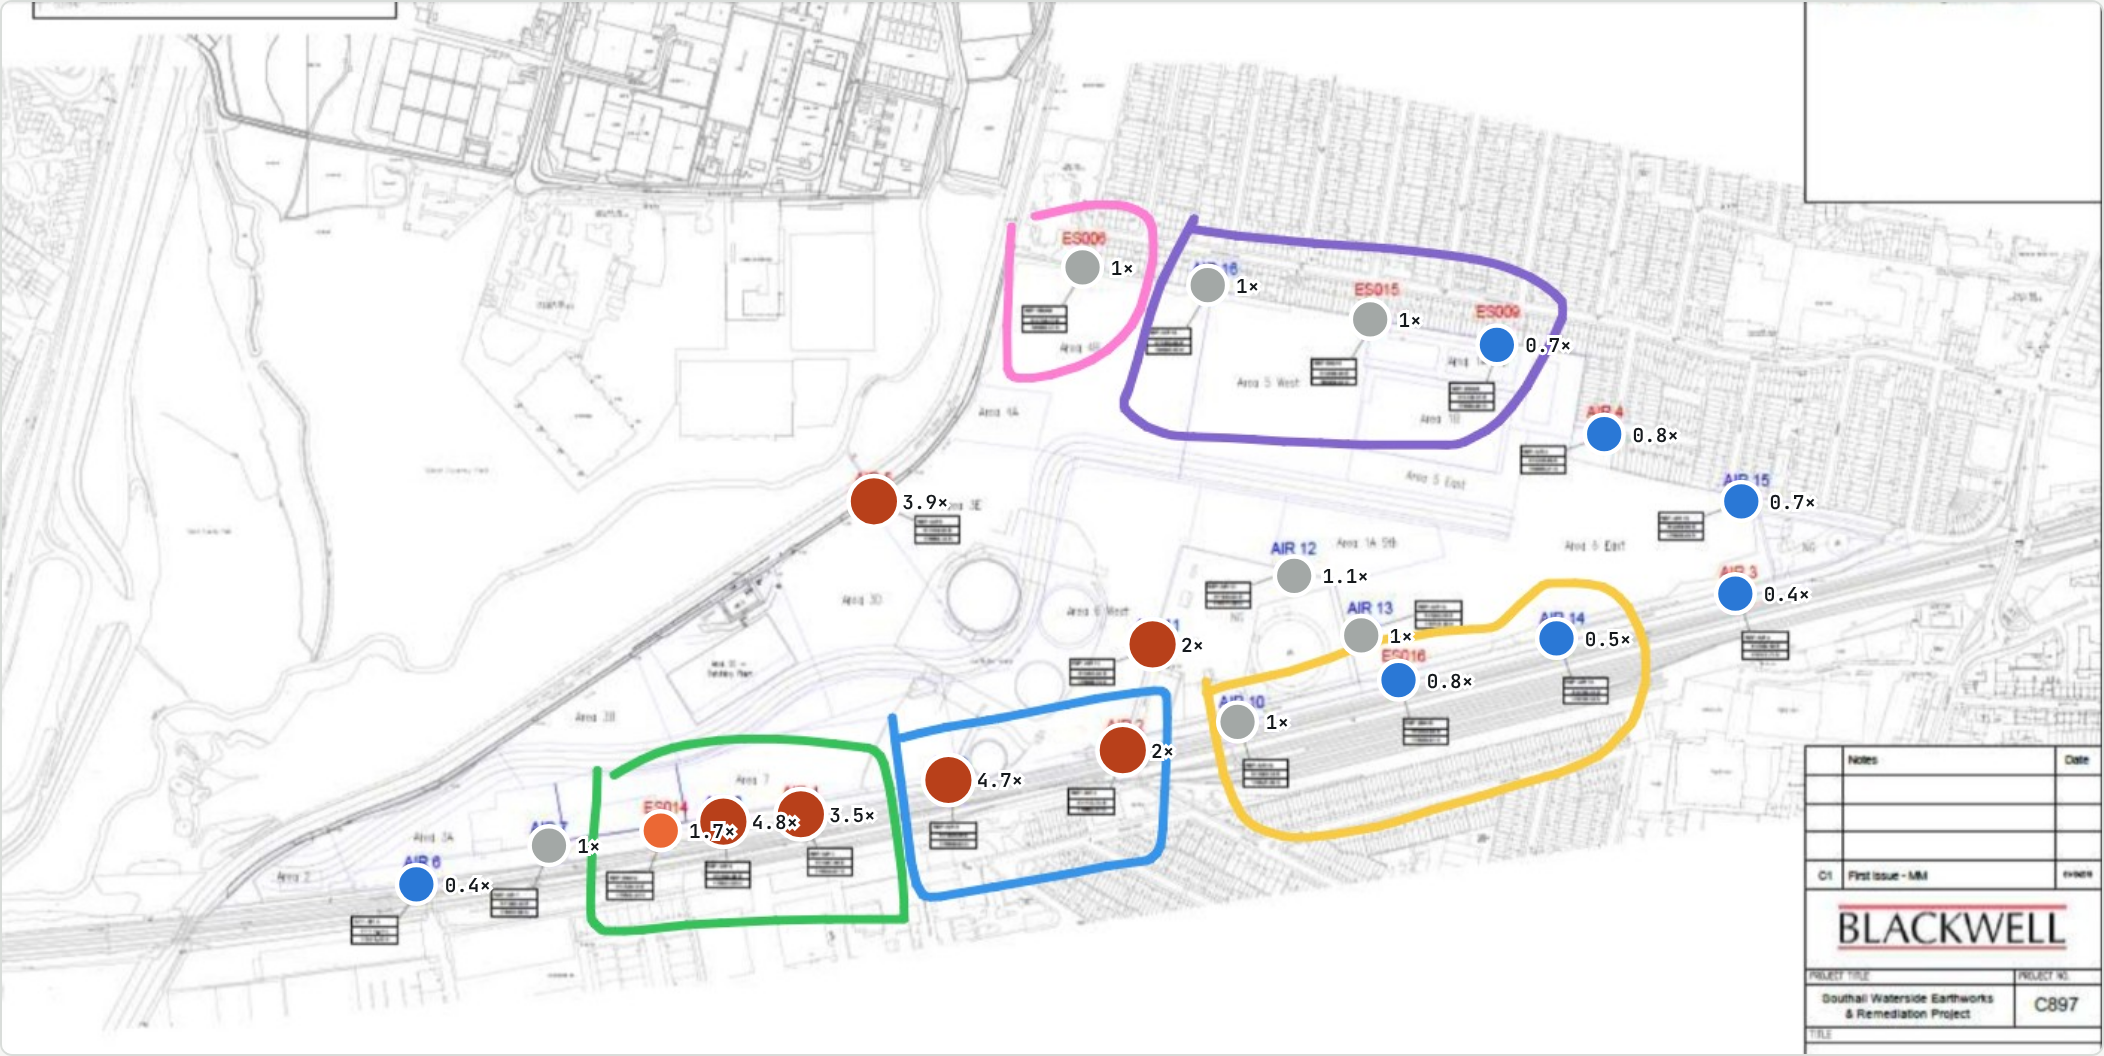
Naphthalene is the chemical that gives mothballs and coal tar their smell. It was one of the site’s main contaminants. At the stations along the southern boundary, next to the soil hospital (Air 1, 5, 8 and 9), naphthalene typically read 3.5 to 4.8 times the median of all stations sampled the same week. Comparing within a week takes out the effect of weather and season.
Benzene rose too at those stations, but much less: 1.8 to 2.8 times. Traffic raises benzene more than naphthalene. Here it was the other way round, which points to the ground rather than the roads.
The highest single week of naphthalene was 248 µg/m³, at Air 5 in November 2018. The World Health Organization’s indoor guideline is 10 µg/m³ as a yearly average. One week above a yearly guideline is not a breach of the law or proof of harm. But the hot-spot stations read high week after week.
The wrong kind of wind
In July 2018 Ealing’s council leader said the smells had become worse because of “high temperatures and unusual wind directions”. Residents’ records show what that meant.
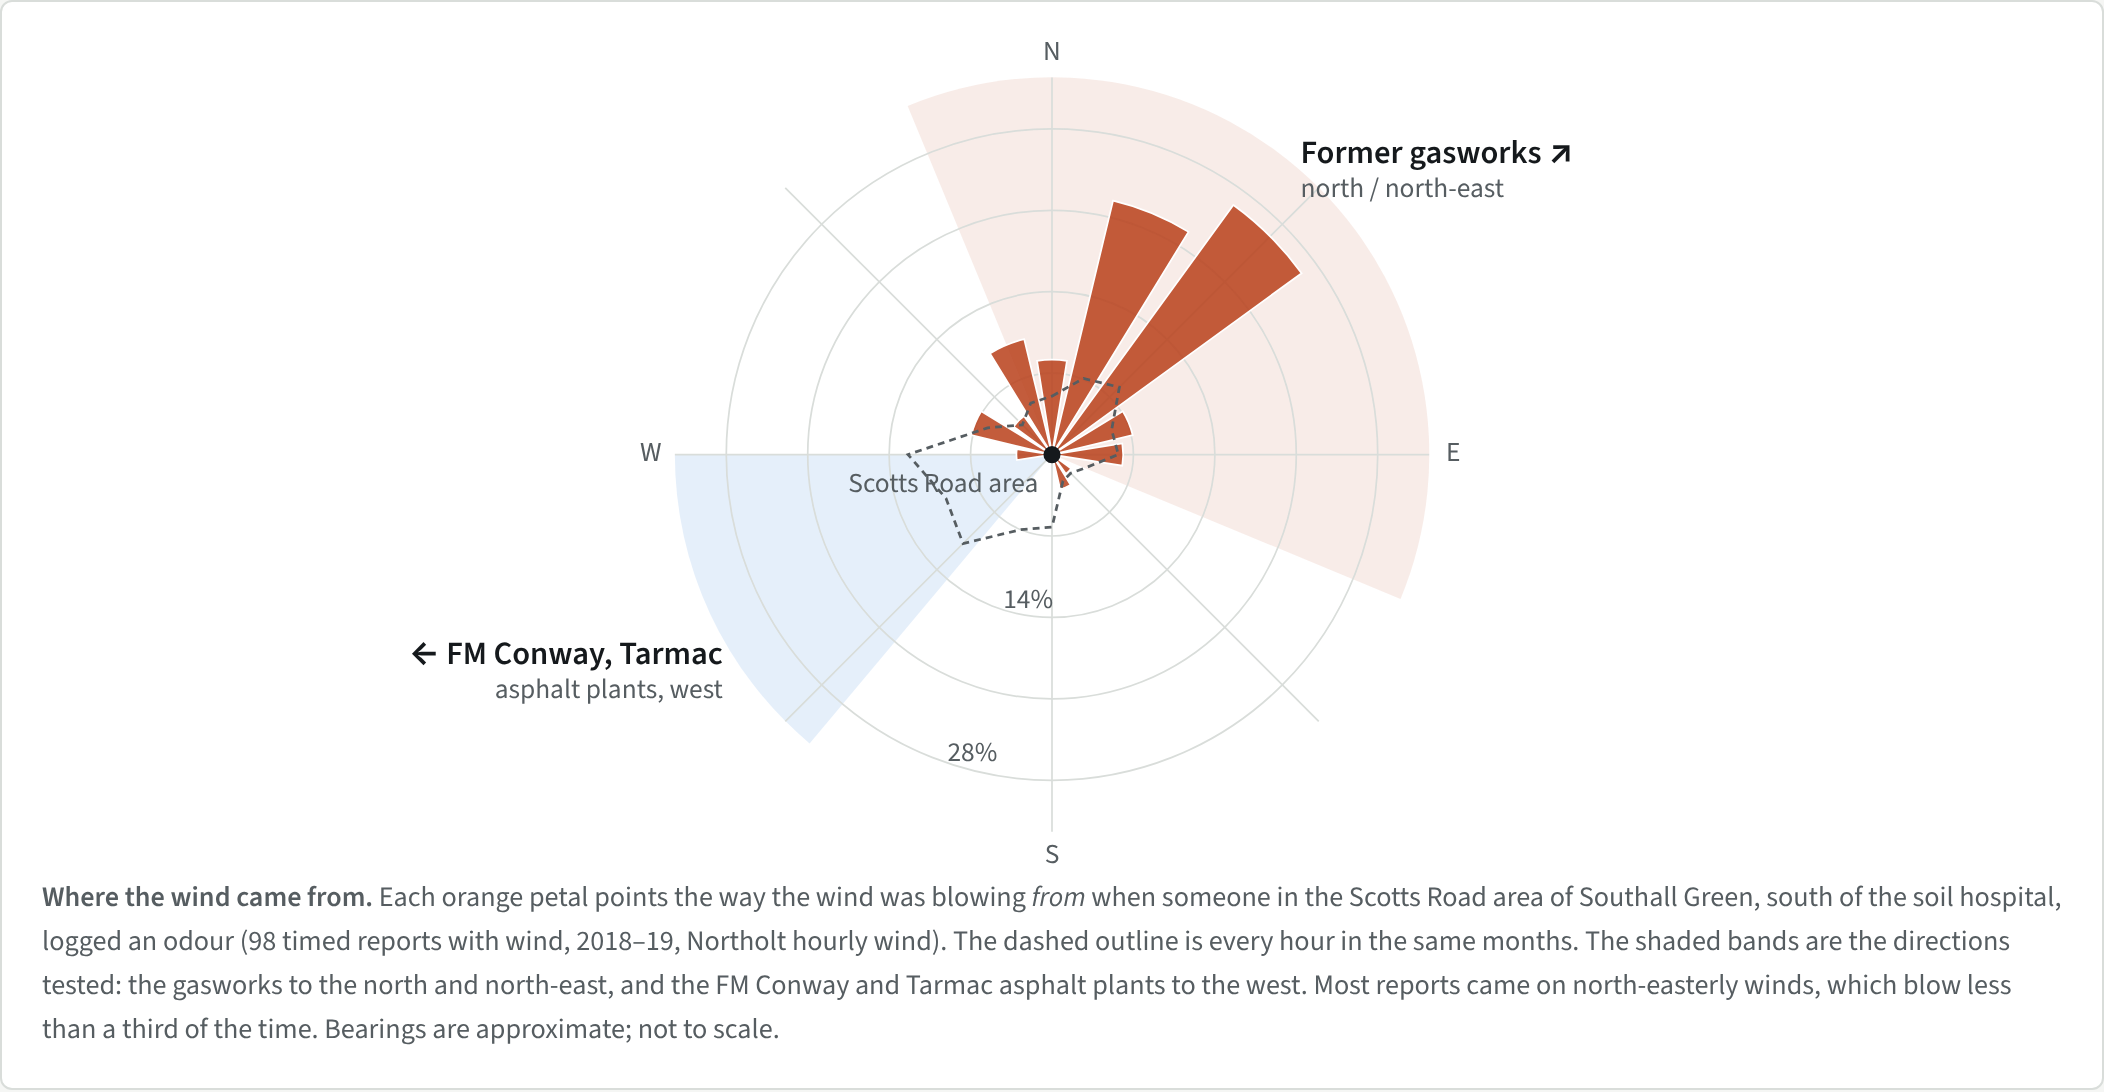
From the Scotts Road area of Southall Green, south of the soil hospital, the gasworks lies to the north and north-east; the FM Conway and Tarmac asphalt plants lie to the west. Of 104 timed odour reports from that area in 2018–19, 73% came while the wind was blowing from the gasworks. By chance you would expect 34%. Only 12% came with wind from the FM Conway direction, against 48% expected.
Winter was supposed to be better
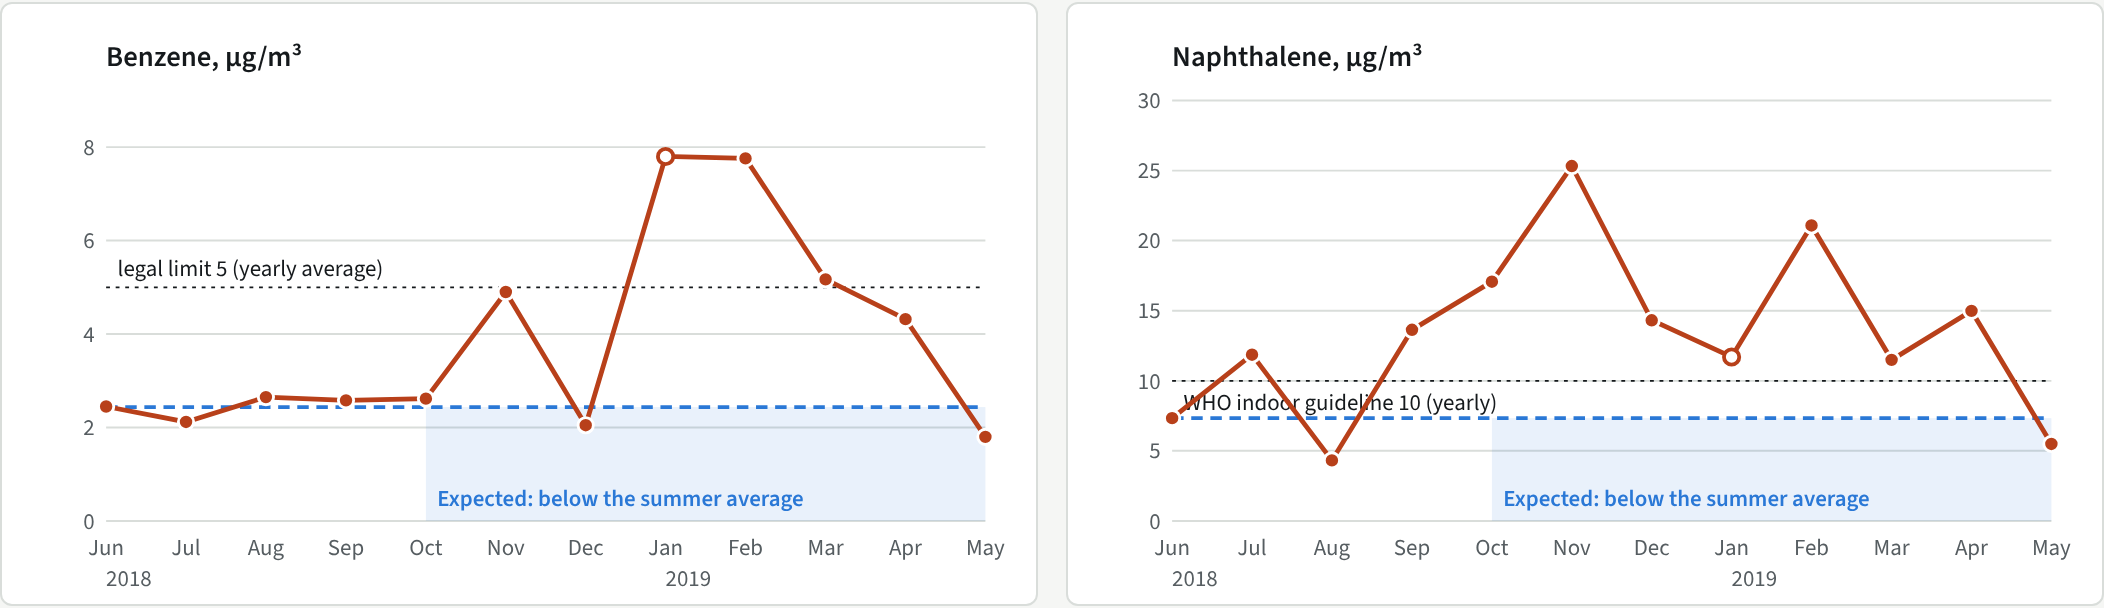
In autumn 2018 residents were told summer was the worst period, and that readings would fall in cooler weather. At the ten stations monitored throughout, the opposite happened. Average benzene went from 2.4 µg/m³ in summer 2018 to 5.3 from November to April; naphthalene from 7.3 to 17.8. Naphthalene rose at all ten stations.
Winter air disperses pollution less well, and traffic and heating add to it everywhere. So this shows the forecast was wrong, not on its own that the site emitted more. The same-week comparisons above allow for that.
Readings did not fall when the soil hospital stopped
The soil hospital stopped treating soil at the end of March 2019. Once wind direction is allowed for, April’s naphthalene at the hot-spot stations was statistically the same as in the operating months (×0.94). Levels fell only in May.
A solvent in the park
In the week to 4 April 2019, two tubes recorded trichloroethene (TCE), a solvent classed as a known human carcinogen: 400 µg/m³ at Air 4 on the north-east boundary and 475 µg/m³ at Air 19 in Minet Country Park. Smaller amounts recurred into May.
The official explanation, from the developer’s consultant Atkins and repeated by Public Health England, was road asphalting or off-site tarmac plants. But Atkins’ own 2016 risk assessment had found TCE in the site’s groundwater along the northern boundary, at up to 100 times the water standard, and made it a clean-up target there. On the record I hold, that was not mentioned when the readings were explained. The source is still not settled.
Who was considered?
Naphthalene can damage red blood cells. People with G6PD deficiency, an inherited condition far more common in families of South Asian, African and Middle Eastern heritage, are more vulnerable; Public Health England said so for this site in July 2019. In March 2019 PHE said naphthalene levels “should urgently be reduced”.
Southall is one of the most South Asian communities in Britain. In the 2021 census, 74% of residents of Southall Green ward and 80% of Southall Broadway ward were of Asian heritage. A full health impact assessment, involving local people, was recommended before planning permission was granted. The one produced in 2008 assessed dust and traffic, not vapours from the soil. I have found no assessment that asked how many people living downwind might be at greater risk.
What residents were told
In September 2018, at a meeting with residents attended by Berkeley’s chairman, Tony Pidgley, and executive director Karl Whiteman, residents were told emissions were all “within legal limits”. That same month, at Ealing’s air quality scrutiny panel, councillors asked whether the benzene standard had ever been breached and, according to the official minutes, “heard that it had been breached”.
The missing pages
Planning permission required a site-wide construction management plan before any remediation began. Condition 12 said it must include “a suitable and efficient means of monitoring and suppressing dust, vapours and odours”, and identify the most sensitive homes and businesses where monitoring would take place.
The site-wide plan drawn up in May 2016 by St James, part of the Berkeley Group, mentions vapours only when quoting that condition. Its air monitoring is for dust: daily visual checks, particulate monitors and weather records. It sets no vapour or odour monitoring and no level at which work would stop. Its list of “most sensitive receptors” comes from a noise assessment.
Each phase then needed its own plan. The one for Phase B, on the eastern side of the site south of Beaconsfield Road, covered the basement dig, remediation and building work there. Berkeley submitted it in March 2019, during the monitoring period, and Ealing approved it on 15 July 2019 (ref. 191339CND). The copy on Ealing’s planning portal has only 14 of its 32 pages. Its contents list air quality on page 22 and noise and vibration on page 24, but the scan stops at page 13. In 2022 a local group asked for the missing pages. Ealing confirmed the gap and said: “We do not hold the paper file in our archive either.” It sent the 2016 site-wide plan instead, and then a 2021 plan for a later phase.
The version Ealing approved was revised in June 2019 after comments from Transport for London. In the copy I hold, its contents stop at site access, with no air quality section at all. The officer’s report notes only that TfL was now content.
That 2021 plan does set a stop rule for dust: if PM10 passes 190 µg/m³, “works should cease”. In 2018, Berkeley had told the scrutiny panel there were “no formal scores for odour complaints that would trigger a decision to stop”. Even in 2021 there was no number for vapours: Tenax tubes were to be used only when digging below the clean cover layer, where the ground is still “considered as contaminated material”.
What next
This is a first account. I am still waiting on information requests about the spring 2019 works, the developer’s vapour action levels and the monitoring officer the council was paid to fund.
If you lived near the site in 2017–2019 and kept a record of smells or symptoms, I would like to hear from you.
Corrections are welcome. The full interactive page, with sources and caveats, is here.